1. Airglow from the mesopause region (80 - 100 km altitude) of the terrestrial atmosphere is mainly due to emission bands from the diatomic molecules OH and (electronically excited) O2. These emissions are produced by chemical excitation.
2. The OH(6-2) and O2b(0-1) bands are composed of many lines corresponding to different rotational transitions. Their intensity varies with rotational quantum number, depending on (rotational) temperature, molecular constants, and transition probabilities (Einstein coefficients). This is the band structure computed for 200K from the quantum mechanics of both molecules.
3. This short section of the airglow spectrum that covers most of the visible and infrared permits to measure temperature at 87 km for OH, and 95 km for O2b(0-1): spectral range with neigboring emission bands (from an airglow "atlas").
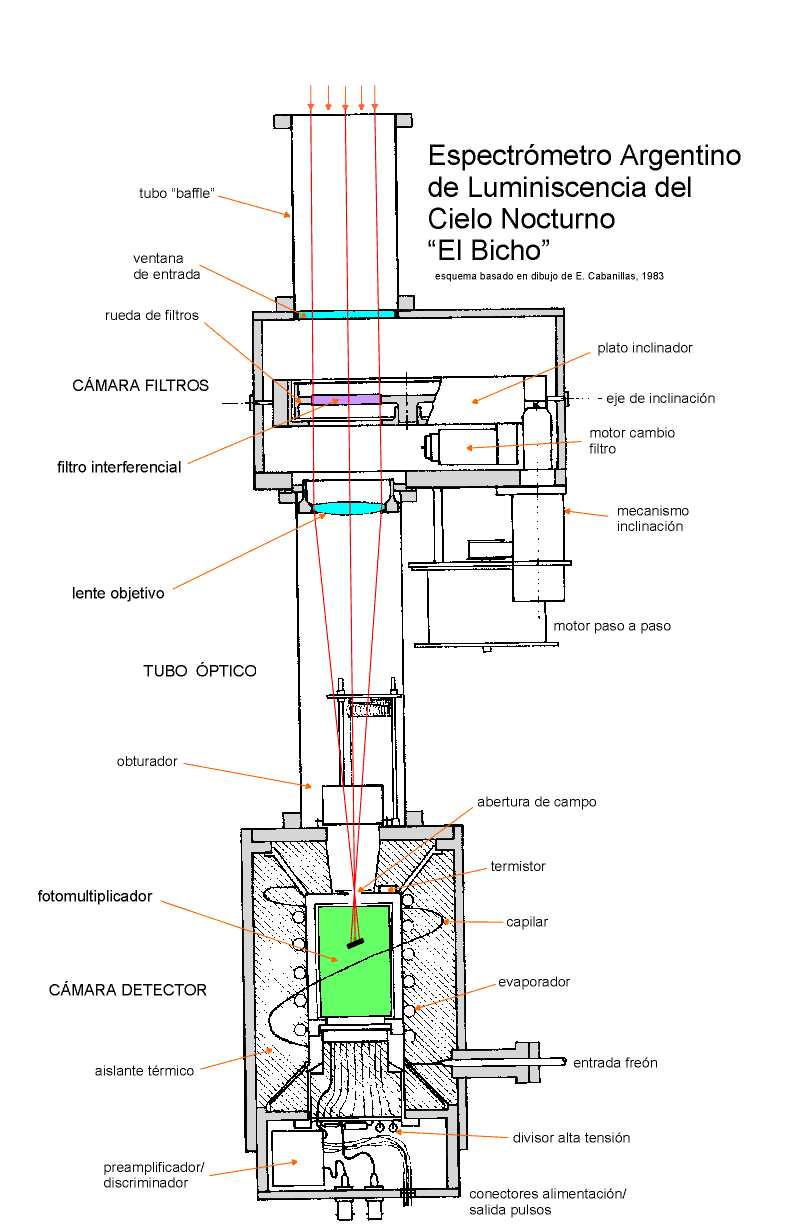
4. We do our airglow observations with a tilting filter spectrometer installed at El Leoncito.
5. By tilting the interference filter, filter transmission shifts with little degradation of half-width.
6. This is how the airglow spectrum looks like, with the instrument's moderate spectral resolution.
7. Temperature retrieval from each set of spectral samples requires instrument calibration greatly helped by very precise Neon lines emitted by simple gas discharge indicator lamps.
8. Since intensity measurements are based on counting photons, long-term instrument stability is good.
9. The spectrometer is controlled by computer via a home-made controller card.
10. Instrument performance also depends on software, shown in this instrument control program listing.
11. Housekeeping information and data acquisition logs are shown in this sample log file (during normal operation).
12. Plots of our data and more information are shown here.
Last update: June 6, 2018
IAFE Aeronomy home page